

Shine a Light on the Metrics That Matter With Symantec CloudSOC
Creating customized dashboards and five reports to get you started
Symantec, by Broadcom Software, is dedicated to protecting customers’ information assets. One of our flagship platforms is Symantec CloudSOC, the leading Cloud Access Security Broker solution in the market. For the last eight years I have helped many organizations leverage CloudSOC to a) provide visibility into their cloud security landscape, b) enforce acceptable usage policies for Software as a Service (SaaS) applications and c) leverage process automation to reduce exposure in cloud security initiatives. However, what consistently surprises me is that customers are often unaware of functional areas in CloudSOC that can help their stretched teams be highly effective at reducing risk.
Information overload is a problem I see all too often. Let’s face it, most cyber security products generate large amounts of data. Without the relevant context or granular level of detail, the problem is that data can’t help inform your next action or provide useful insight.What can a practitioner do with mountains of data? How do you sift through activity records, content inspection incidents, suspicious user detections -- not just for one but potentially thousands of monitored SaaS applications to identify use-case adherence or policy violations? What’s required is prioritization and visibility into use-case coverage. Context really helps here and we’re proud that when compared across CASB platforms, CloudSOC is more granular in the visibility it provides than most. A further complication is the inevitable variability across different organizations' security cultures and use-case prioritization. I have never seen two organizations with the same approach to cloud security, so a flexible solution is needed.
To this end, CloudSOC’s Custom Reporting Dashboards is a powerful capability. You can use it to construct tailored views for custom use-case visibility. Additionally, these dashboards can be scheduled and exported as PDF reports or shared via console with other CloudSOC admins.
Five example Use Case reports to get you started
The most successful organizations not only know how Custom Reporting Dashboards work, they also have well defined use cases. Below are five examples of custom widgets you can create with Custom Reporting Dashboards:
- Pie-chart reporting on use of prohibited SaaS apps. Use CloudSOC Audit for visibility on whether prohibited SaaS apps like VPN services, code hosting repositories, PDF content conversion apps, or online presentation services are in use.
- Pie chart reporting on use of redundant SaaS apps. Use CloudSOC Audit for visibility on whether SaaS apps beyond sanctioned functionality are in use. For example, if O365 is the sanctioned SaaS app for collaboration, has Box, or Google Workplace also been adopted? Are other email services in use beyond the corporate standard?
- Bar chart on SaaS app usages for Apps hosted in prohibited countries. Use CloudSOC Audit to show if an employee is using a SaaS app that is hosted in a country listed in your filter.
- Tables showing SaaS apps that have the “review” tag applied. Use CloudSOC Audit to show SaaS apps that have been discovered and put into a review process defined by the customer. The audit-tagging model is very useful in providing additional context as CloudSOC admins proceed with procedures on how to address Shadow IT.
- Vulnerable Documents and Malware. Powered by the File Sharing Securlets widget and CloudSOC malware detection engine, this tool lists the top users whose folders (i.e., OneDrive, Box, etc.) contain malware.
Other examples of tags used by customers include:
- Tolerated risk
- License required
- Sanctioned
- Unsanctioned
- Review Complete
- Block
- Prohibited
The use cases above are just examples. Hundreds more have been defined by CloudSOC admins. Other common considerations that have been built into dashboards are, but not limited to:
- Different time intervals such as one week, one month, three months
- Amount of data uploaded/downloaded to prioritize remediation
- By geographical region or network segment
- By SaaS app category
- By SaaS app
Where do I find the dashboards?
In the CloudSOC console, click on the second icon on the left navigational pane to see the drop-down list and choose “reporting dashboard’
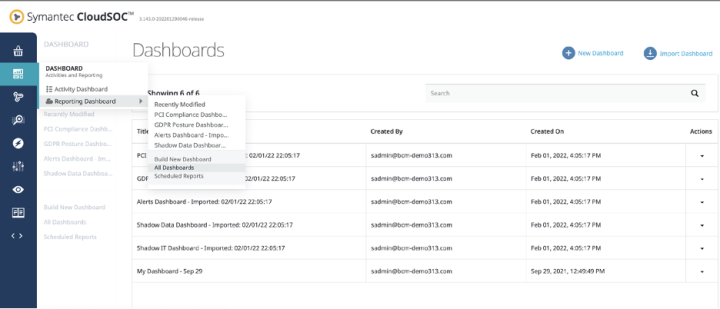
Are there existing dashboards I can use as starting points?
Yes, though not by default. You will notice in the upper right of the “All Dashboards” screen there is an “Import Dashboards” option. This option imports five prebuilt factory dashboards that are great templates to use as a starting point. You can also import/export dashboards as json files to share with other CloudSOC tenants, including those in a sandbox.
How the dashboards work
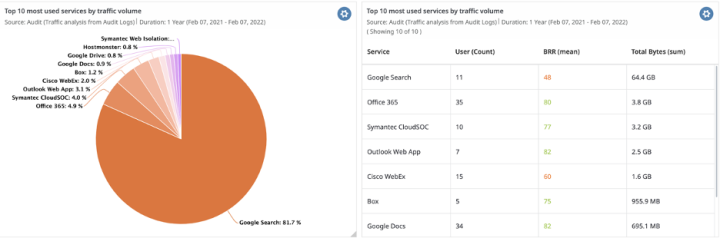
The dashboards are made up of one or many widgets that can provide graphical or table views for defined-use cases.
For example, below are two widgets: a pie chart and a table showing the “Top 10 most used services by traffic volume.”
Other views are available, such as the line graphs depicted below showing the “Trend of cloud service adoption by # of service use and traffic.” (Bar graphs, other views and additional color schemes are also available.)
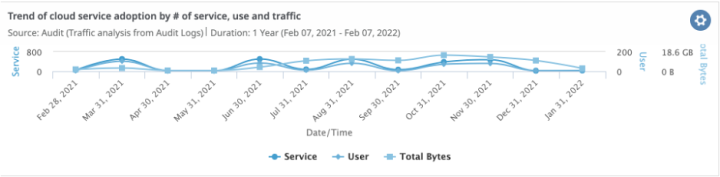
Once in the dashboard, these widgets can be resized, moved, modified, cloned, etc. They give CloudSOC admins a way to create truly tailored views into the status of their cloud security initiative and how different use cases are being met or not. Dashboards can also be shared and exported as scheduled report links.
It is important to note that in addition to the factory default dashboards, there are dozens of prebuilt widgets in the library that can be imported into a dashboard as well as ones that can be created from scratch. There are also hundreds of filters that can be added to a widget for the broad variation seen with organizational use-case definition.
What matters most to you? Defining your Use Cases
Now that we have discussed what Custom Reporting Dashboards are and examples of common-use cases, what is it you are trying to do? What use cases do you have? What visibility is needed? Would using graphical views to help surface the most critical issues be of use? The most mature CloudSOC customers use a team approach in understanding the capabilities of the platform and establishing consensus on the dashboards they build. Take a look at the predefined use cases in the factory default dashboards and/or predefined widgets, play around with creating widgets from scratch to see what you may have been missing.
If you are a Broadcom CloudSOC customer and just discovering the functionality of the Custom Reporting Dashboard, take a look at the Knowledge Base which has great content. If you need additional assistance, contact your sales representative who can assist you in understanding what training options may be available.

4 Numbers That Will Lead to Better Protection in 2022
Symantec helps you solve your toughest challenges

Symantec Web Protection Suite: A Single Gateway for Web and Cloud Applications
At the office, working from home, surfing the web or using cloud applications - Symantec is there for you


We encourage you to share your thoughts on your favorite social platform.